UKCS Decommissioning: A Practitioner Guide
Plain-language guide for operators’ decommissioning teams · companion to the Theoretical Guide (White Paper V10.2) · not peer reviewed
Dr J. Neil Scott · Meginráð Research · Download PDF · Theoretical Guide (PDF)
- 1. The short version
- 2. What happened in 2024
- 3. Which fields close, and when
- 4. Shared infrastructure
- 5. The tax question: what the data can and cannot say
- 6. Three scenarios to 2032
- 7. What the decommissioning documents show
- 8. A check before the gate
- 9. Common questions
- 10. What to do on Monday
- Appendix A. The statistics, in a box
- Appendix B. Glossary
- Appendix C. What we have withdrawn
This guide turns our research into business terms for the people who plan, document and pay for UKCS decommissioning. It keeps the statistics to a minimum and puts the technical detail in Appendix A.
It is a companion to the Theoretical Guide (the full white paper), which sets out the methods, tests and limits in academic detail. Where the two ever differ, the Theoretical Guide and the Canonical Outputs Register govern.
Everything here is descriptive or exploratory. It shows patterns in the data. It does not prove cause, and it is not a forecast, regulatory advice or a substitute for your own engineering and legal assurance.
1. The short version
Fields are closing faster than the pre-2022 pattern, they close earlier when they are wet and have stopped drilling, and the paperwork that supports a closure is often the slowest, least consistent part of the job.
- 2024 was an outlier. 22 UKCS fields stopped producing, about 1 in 13 of the fields operating, against about 1 in 41 in an average year from 2015 to 2021.
- Wet fields close more. Oil fields producing at least 85% water (a water cut of 0.85) close at about twice the rate of other oil fields. 51 of the 157 oil fields still producing in 2024 were above that line. It is a warning sign, not a limit: many fields run profitably beyond it.
- Drilling matters. Each year without a development well adds about 5% to a field’s chance of closing.
- The timing fits the tax change but does not prove it. Oil prices do not explain the 2024 closures. The Energy Profits Levy (EPL) escalations fit the timing, but one basin and a short history cannot establish cause.
- Shared pipelines are where risk concentrates, but we no longer put a probability on it. Earlier hub probabilities could not be reproduced and are withdrawn. We report counts of feeders instead.
- Decommissioning documents are a risk of their own. In our reading of 363 public documents, 8 of 13 close-out reports with cost data finished over budget, and weather and vessel availability recur as causes of delay.
- A check before the gate can help. A fixed-fee, independent Pre-Submission Consistency Review tests whether the documents in your submission agree with each other and with published requirements. A no-cost pilot is available (Section 8).
2. What happened in 2024
The UK Continental Shelf has been declining for twenty-five years. Oil output is down 78% from its 1999 peak, and the UK now imports 57% of its gas. Decline on its own is expected in a mature basin. What was unusual in 2024 was the speed of closure.
A field “ceases production” (the regulator’s term is Cessation of Production, or CoP) when it stops for good. We track every offshore field from 1975. The share of fields closing each year averaged 2.46% between 2015 and 2021. In 2022 it fell to 0.67% (2 fields). In 2023 it was 1.36% (4 fields). In 2024 it jumped to 7.46% (22 fields of 295 operating at the end of 2023), three times the earlier average and the highest in the record.
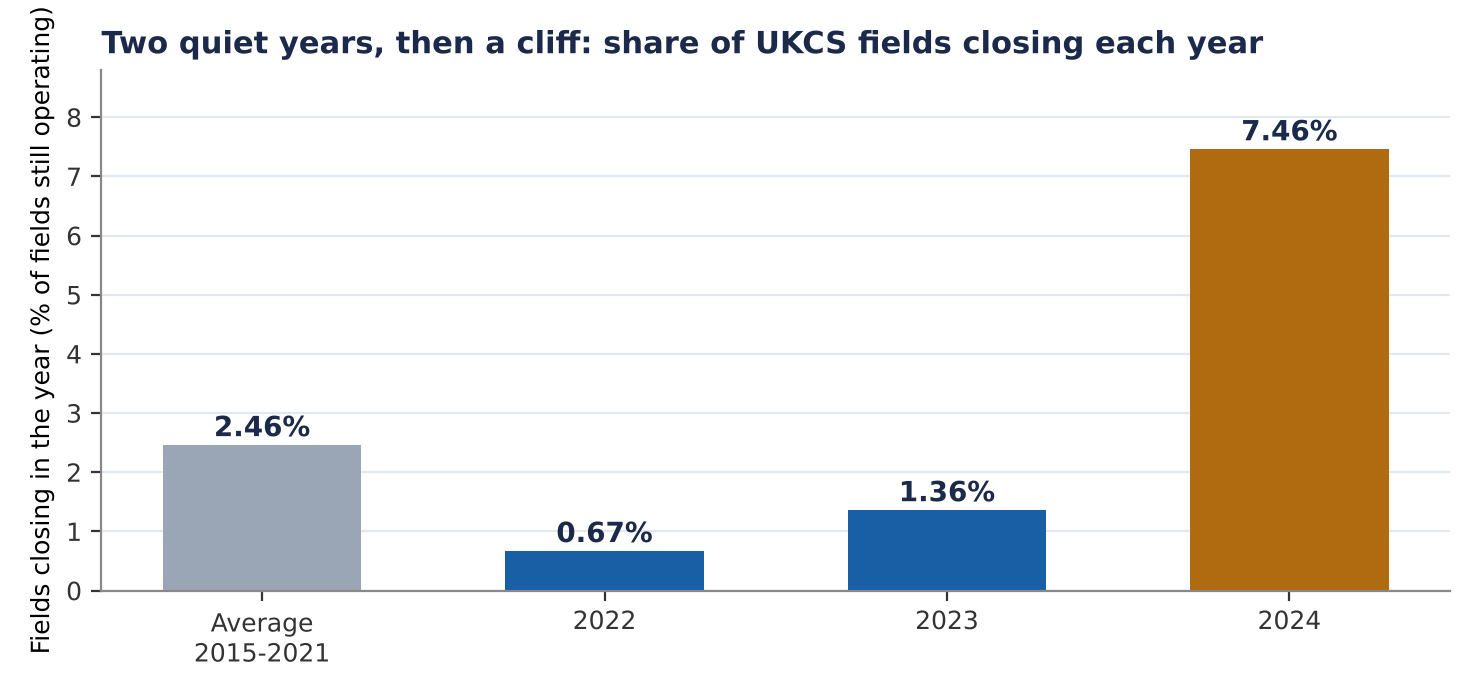
Two quiet years followed by a cliff is what you would expect if investment decisions were put on hold in 2022 and the closures arrived later. It is also what several other explanations would produce, which is why Section 5 is careful about cause.
3. Which fields close, and when
3.1 Water cut: when handling water starts to cost more than the oil is worth
Water cut is the share of a field’s produced liquid that is water. At a water cut of 0.85, a field produces 85 barrels of water for every 15 barrels of oil. Every barrel of water must be separated, treated and disposed of, and much of that cost is fixed. As water cut rises, the same facility earns less from each barrel handled.
Across oil-producing fields since 2011, those at or above 0.85 closed at about twice the rate of the rest (5.3% against 2.6% of field-years). The rate keeps climbing: about 4% for fields between 0.85 and 0.95, and 8.2% above 0.95. 51 of the 157 oil fields producing in 2024 (32%) sit at or above 0.85.
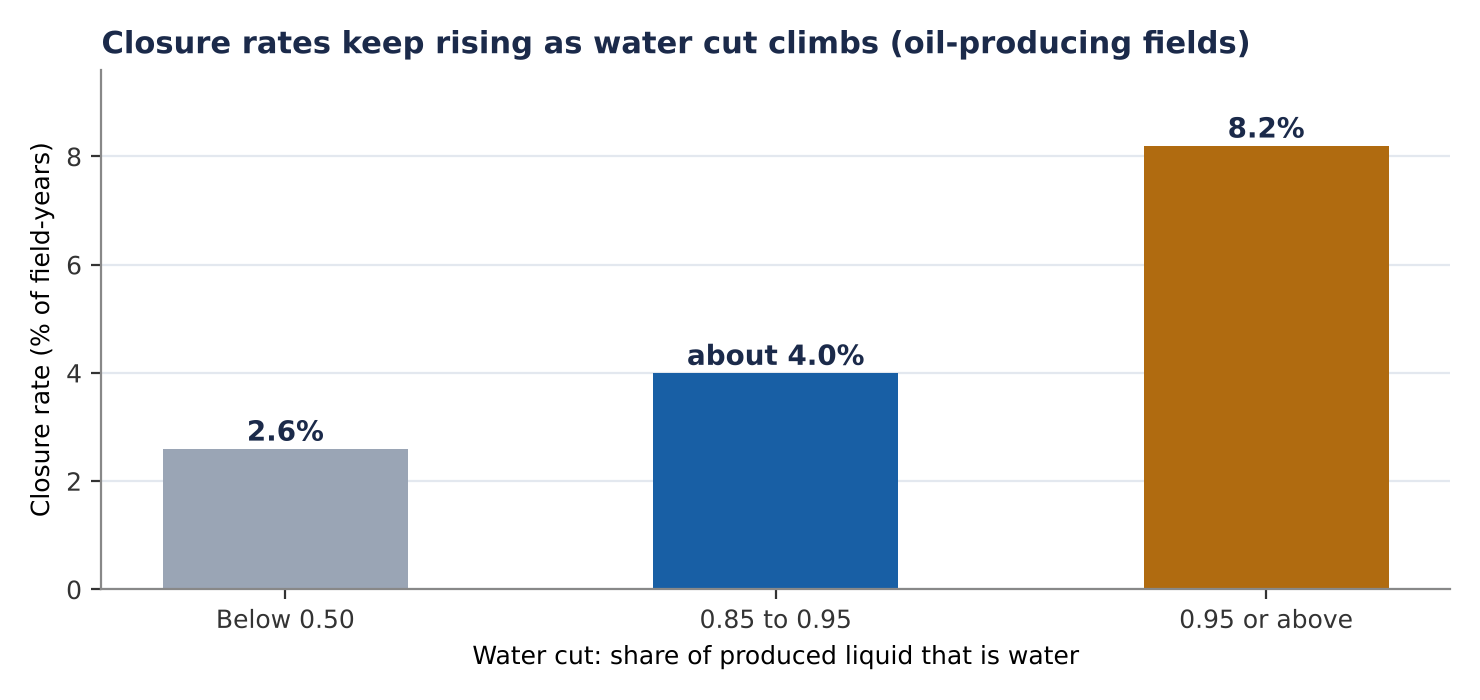
Many mature UKCS fields operate profitably well beyond 85% water. The economic cut-off usually lies nearer 90 to 98%, and depends on water-handling capacity, operating cost against the oil price, and artificial lift. We use 0.85 because it is the programme’s established warning line and was not chosen to fit the data. The data actually fit best at 0.90.
The effect has also changed over time. It was very large in 2011 to 2015, when most closures were of wet fields. It is harder to see in 2016 to 2021, when closures in 2020 and 2021 looked more like price and demand shocks than depletion, and it is back in 2022 to 2024. When closures are resampled by operator, the two later periods cannot be reliably told apart. What survives is that the effect was largest in the first period. For planning, treat water cut as one signal among several, not a countdown.
3.2 Drilling: fields that stop investing close sooner
Each year without a development well adds about 5% to a field’s closure risk. The effect compounds, so ten years without a new well is roughly 1.6 times the risk of a field that is still drilling (simple arithmetic on the 5% figure). Drilling in a given year also points to lower risk, but that result is not precise enough to rely on. Read together, they are consistent with a simple story: when capital stops flowing to a field, closure follows. For a decommissioning team, the date of the last well is an early, observable signal.
3.3 Back-chain liability: a signal to watch, not proven
Section 29 of the Petroleum Act 1998 lets the regulator require a former interest holder to contribute to decommissioning costs. Fields with high exposure to this back-chain show a higher closure rate, but across the full period the difference is not statistically significant. In the levy era alone it is larger, based on only 28 closures, and was found by comparing periods, so we treat it as exploratory. The exposure measure is a proxy and has not yet been checked against the licence transfer register. If you carry historic interests, it is a reasonable prompt to check who sits behind your assets, not a finding about your assets.
3.4 What does not tell you much
- Operator type. We tested whether international majors, private-equity-backed operators and others differ in how long their fields last. The apparent differences do not survive a proper test: they are driven by a few operators. No type, including private-equity-backed operators, can be shown to close fields sooner.
- Concentration. Three operators account for 47 of the 89 closures in the main sample (53%). Patterns in the data are therefore heavily shaped by a few companies’ decisions.
- Forties-only results. Within the Forties system the water cut effect cannot be confirmed (too few closures), though years without a well still matter.
4. Shared infrastructure
Most UKCS production reaches shore through a few trunk pipeline systems. Their costs are largely fixed, so each field that closes leaves the remaining users sharing the same bill. At some point a marginal field becomes uneconomic, closes, and pushes costs onto the next one. That is the idea behind the “cascade”, and it is a sound mechanism in principle.
What we no longer claim. Earlier editions put a closure probability on each pipeline system (for example 83% for the Forties Pipeline System). Those numbers could not be reproduced from the audited data and are withdrawn. The cascade timing (around 2029 for Forties, 2030 for Norpipe) is suspended with them. What we can say is where the exposure sits:
| System | Live feeders (audited) | At or above 0.85 water cut | Comment |
|---|---|---|---|
| Forties (FPS), oil | 66 | 19 (13 at 0.90, 7 at 0.95) | Critical to the Acorn CCS project |
| FUKA, gas to St Fergus | 13 | 3 | St Fergus is the planned Acorn injection point |
| Norpipe, oil to Teesside | 7 | 1 | Also carries Norwegian-sector volumes, so UK feeders alone do not set its viability |
| FLAGS, gas | 2 | 2 | A count only; depends on export volumes and gas specification |
| CATS | 13 (unaudited) | n/a | No closures since 2010, so not modelled |
A feeder count is an imperfect proxy. What governs a shared pipeline is throughput, tariffs and fixed operating cost, and the physical minimum volume is an engineering question we have not answered. The practical reading is that these counts show where tariff burden and cost concentration are rising, not that any system is about to fail. If you ship through a shared system, the useful question is what your host operator expects the tariff to do as feeders leave.
5. The tax question: what the data can and cannot say
Did the Energy Profits Levy cause the 2024 closures? The honest answer is that the timing is consistent with it, and that we cannot prove it.
We cannot run the usual field-by-field test because the levy is the same for every field and only began to bite in 2024. Instead we asked what the closure rate would have been if it had followed the oil price, as it did before 2022. The answer is about 2.8%. The actual rate was 7.46%: roughly 4.7 percentage points higher, or 2.7 times the prediction.
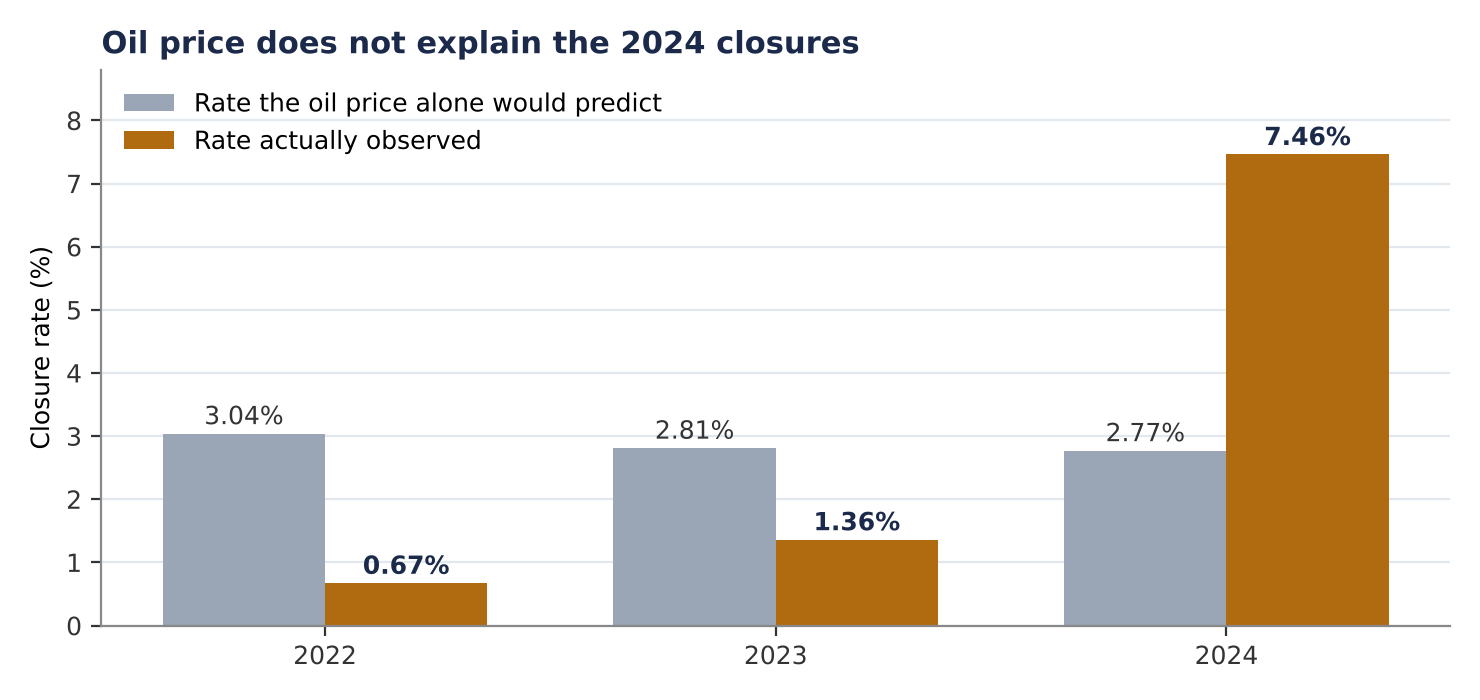
A second method, fitting a trend line through 21 years of data, points the same way: a fall in closures after 2022 followed by a rise. Both methods have the same weakness. They compare a single basin with its own past, with no comparison group, and only one post-levy year lies above the prediction. Something else that coincided with 2024 could be involved. The responsible summary is: oil price does not explain 2024, the timing fits the levy escalations, and causation is not established.
5.1 What the company accounts show
Three published 2024 figures illustrate how the levy can bite on cash, whatever the cause of closures:
- Harbour Energy’s effective tax rate was 107.6% ($1,312m of tax on $1,219m of profit).
- Serica Energy’s effective tax rate was 63.8% (£67.6m on £106.0m of profit before tax).
- Serica paid £130m in dividends against a decommissioning provision of £18.8m, about 6.9 times the provision.
These are individual company figures from public accounts. They are not a measure of the whole basin, and we draw no conclusion about any firm’s decommissioning funding from them. They do show why decommissioning provision and tax design are now linked questions.
6. Three scenarios to 2032
To show what different closure rates mean, we projected the number of operating fields from 272 in 2024. These are arithmetic on stated assumptions, not forecasts. The 1.5% yearly easing in the continuation case is an assumption, and the managed 4% is a policy assumption.
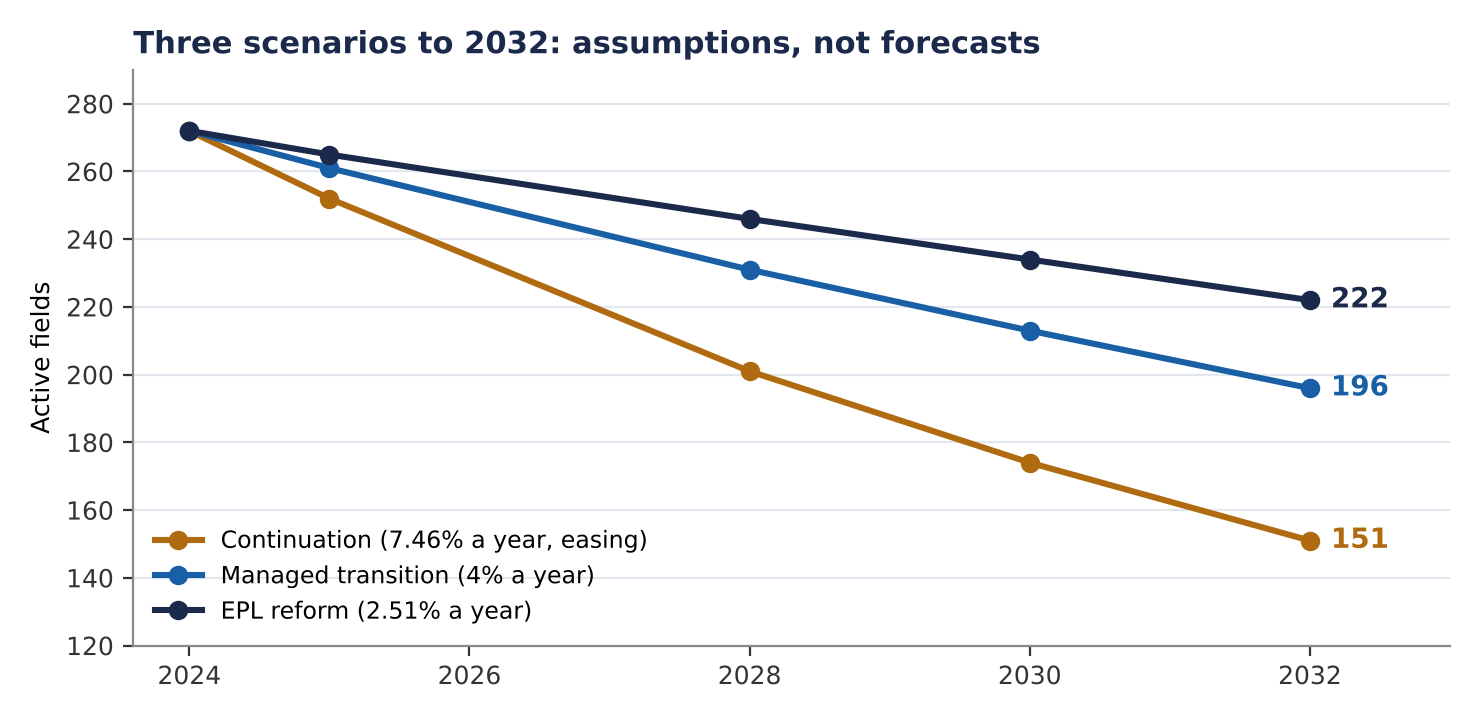
| Scenario | 2025 | 2028 | 2030 | 2032 | Change from 272 |
|---|---|---|---|---|---|
| Continuation | 252 | 201 | 174 | 151 | -44% |
| Managed transition | 261 | 231 | 213 | 196 | -28% |
| EPL reform | 265 | 246 | 234 | 222 | -18% |
Reform keeps 71 more fields operating in 2032 than continuation. That does not mean it raises more revenue. Over 2025 to 2032, reform has more field-years of tax-paying production, so it raises more only if the tax yield per field is at least 81% of continuation’s. Cutting the effective rate from 78% to 40% would reduce yield per field to about 51% at constant profit, so reform needs per-field taxable profit to rise by roughly 58%. An earlier claim of about £0.9bn extra revenue is withdrawn. For a decommissioning team, the useful reading is the range: the number of fields heading for closure in the early 2030s depends heavily on policy and investment choices that are not yet made.
7. What the decommissioning documents show
A decommissioning submission is a set of documents: the decommissioning programme (DP), the comparative assessment of options (CA), the environmental assessment (EA), safety documentation, and later a close-out report. We built a structured extraction of 363 public documents filed with OPRED: 203 programmes, 70 environmental assessments, 55 comparative assessments and 35 close-out reports. 323 are approved, 37 are consultation drafts and 3 are of unknown status. These are counts of documents we could read, not of the UKCS.
7.1 What stands out
- Cost. Of 13 close-out reports that state both an estimate and an outturn, 8 ran over budget and 5 came in under. That is a small sample, and cost bases differ, so it is not a rate. It does suggest that outturn against estimate deserves a line in every programme’s risk register.
- Schedule. At least 10 close-out reports cite weather or vessel availability as a cause of slippage. 2024’s cluster of 22 closures raises an obvious inference, which we flag as inference and not a finding: closure-related work may bunch up and compete for the same vessels and weather windows.
- Disclosure. Costs are commonly withheld or provided to OPRED in confidence. That is normal practice, but it limits what can be benchmarked from public documents. Your own cost history is more valuable than any public comparator.
- Consistency. Our extraction notes record contradictions inside documents: tables that disagree with the text, totals that do not add up, and dates or quantities that differ. These notes were classified by keyword rules and have not been audited by hand, so we quote no rate. A hand-checked sample is the next step.
We have not measured the accuracy of the extraction against a hand-checked sample. Document issue dates are unreliable, so we give no trend over time. Scores and costs use each document’s own scale, so they are compared only within a document. The findings are descriptive and do not support causal claims.
8. A check before the gate
Our reading of the documents points to a practical gap. A submission is written by several teams over many months, and nobody is formally asked whether the whole set agrees with itself. We propose a Pre-Submission Consistency Review: an independent, fixed-fee check that the documents in a submission reconcile with each other and with published requirements, before a gate and not after a query.
The gate model below is version 0.1. It is proposed and is being validated with practitioners. Gates G0, G1, G2 and G5 are being confirmed against current OPRED guidance. G3 and G4 rest on the Offshore Installations (Offshore Safety Directive) (Safety Case etc.) Regulations 2015 (SI 2015/398) and HSE Information Sheets 2/2008 and 3/2006.
| Gate | Question the documents should answer | Main documents |
|---|---|---|
| G0 Cessation planning | Are the decommissioning scope, cost basis and timing defined? | Cessation case, scope inventory, cost estimate |
| G1 Option assessment | Are the options complete, screened and scored defensibly? | Comparative assessment, CA workshop record |
| G2 Programme submission | Do the programme and environmental assessment match the CA outcome and each other? | DP, EA, consultation record |
| G3 Pre-dismantling readiness | Is the revised safety case accepted and the verification scheme revised? | Safety case, risk assessment, verification scheme, well notification |
| G4 Phase transition | Before each substantive phase, are risks, the safety-critical element record and verification updated? | Phase risk assessment, element record, verifier comment |
| G5 Close-out | Are seabed clearance, monitoring commitments and lessons recorded? | Close-out report, clearance statement, survey plan |
Sixteen checks apply across these gates. Examples: components, quantities and boundaries agree across the DP, CA, EA and safety case; the preferred option in the programme matches the CA outcome, and any departure from the lowest-scoring option is explained; cost basis, contingency and withheld figures are stated; rock, vessel-day and emissions figures agree between the CA and EA; the dismantling safety case covers every Schedule 8 particular; and the verification scheme is revised before the safety-critical element record changes.
It is not a regulatory approval, a safety verification or an engineering design review. It does not replace the independent verifier or the duty holder’s own assurance. It compares documents with each other and with published requirements; it does not judge whether the option you chose is the right one.
8.1 The no-cost pilot
To show what the review looks like on a real set of documents, we offer a no-cost pilot: sixteen checks over two weeks on one approved public document set (for example, one of your own approved programmes), with a findings table and a one-page readiness summary. There is no obligation. Scope and timing are agreed in a short call. Request a pilot at meginrao.com or jnscott@meginrao.com.
9. Common questions
Does this mean one of my fields will close?
No. The results describe groups of fields, not individual ones. A field above 0.85 water cut is more likely to close than the average, not certain to. Use the signals to decide where to look first.
Can I quote these numbers in a board paper?
You can quote them as exploratory research findings, with their limits. Please use the figures in this guide and the Theoretical Guide, not older versions (Appendix C lists what is withdrawn). Do not present scenarios as forecasts or the tax timing as proof of cause.
Why are there no probabilities for pipelines any more?
Because the earlier figures could not be reproduced from audited data, and they applied one water cut effect to every feeder when that effect has changed over time. A missing number is better than a wrong one. Feeder counts are what the data supports today.
Why does the guide keep saying “association” rather than “cause”?
Because the data show what happened alongside what, in one basin, over a short post-levy period. That is useful for planning and not enough to prove why. We would rather you can rely on what we say.
Where do the 363 documents come from, and can I see them?
They are public decommissioning documents filed with OPRED. We extracted structure and figures from them as a first pass. Counts are of documents we could read, and we are happy to discuss the method.
Who is behind this work?
Dr J Neil Scott, Meginráð Research, an independent UKCS research practice in Orkney. The analysis is described in full, with its limits, in the Theoretical Guide.
10. What to do on Monday
These are prompts for review, not advice. They follow from the findings above and should be tested against your own data.
- Map your portfolio against the two signals. List each field’s latest water cut and the date of its last development well. Mark fields above 0.85 or more than five years without a well.
- Check your timeline against 2024. If several of your assets could reach cessation in the same two or three years, test the schedule against vessel and weather availability early.
- Know your shared systems. For each trunk system you use, record feeder numbers and ask the operator how tariffs are expected to move as feeders leave.
- Look behind your interests. Where you hold or have sold historic interests, check Section 29 back-chain exposure and who stands behind each asset.
- Reconcile the document set. Before each gate, check that quantities, options, costs and emissions figures agree across the DP, CA, EA and safety documents.
- State the cost basis. Make sure every cost figure has a stated basis, contingency and cost year, and that withheld figures are clearly marked.
- Compare estimate with outturn. Record outturn against estimate for your own completed work, and use it in the next estimate.
- Treat models as screens. Use survival results to decide where to look first, not to set dates.
- Try the pilot. Ask for the no-cost pilot on one approved document set and see what the review finds.
Appendix A. The statistics, in a box
Hazard ratio (HR). How much more often something happens in one group than another, other things equal. HR 2 means about twice the rate; HR 1 means no difference; HR below 1 means lower.
95% confidence interval (CI). A range of values consistent with the data. If it includes 1, we cannot rule out no effect.
p-value. How surprising the result would be if there were really no effect. Small values (below 0.05) are conventionally called statistically significant. It does not measure how big or important an effect is.
Exploratory. Found by looking at the data in several ways. Worth watching, not safe to rely on.
| Finding | Value | Plain reading |
|---|---|---|
| Water cut at or above 0.85 | HR 1.99 (CI 1.25 to 3.18, p = 0.004) | About twice the closure rate of other oil fields |
| Years since last development well | HR 1.05 per year (CI 1.01 to 1.08, p = 0.005) | About 5% more risk for each year without a well |
| Drilling in the year | HR 0.13 (CI 0.02 to 1.05, p = 0.056) | Probably protective, not precise |
| Section 29 high exposure | HR 1.43 (CI 0.92 to 2.21, p = 0.112) | Points higher, not statistically significant |
| Section 29, levy era only | HR 2.91 (CI 1.34 to 6.36); interaction p = 0.030 | Exploratory; 28 closures |
| Operator archetype, operator-level test | p = 0.48 | No reliable difference between operator types |
| 2024 rate against price-predicted rate | +4.7 points; 2.7 times; 4.2 standard deviations above the pre-levy mean | Not explained by oil price; cause not established |
Main model: 2,448 field-years, 219 oil-producing fields, 89 cessations, post-2010, excluding CATS; standard errors clustered by field. Source: Theoretical Guide (White Paper V10.2), Sections 3 and 4; Canonical Outputs Register.
Appendix B. Glossary
| Term | Meaning |
|---|---|
| CoP | Cessation of Production: a field stops producing for good. |
| DP, CA, EA | Decommissioning programme; comparative assessment of options; environmental assessment. |
| OPRED, NSTA, HSE | The Offshore Petroleum Regulator for Environment and Decommissioning; the North Sea Transition Authority; the Health and Safety Executive. |
| EPL | Energy Profits Levy: an extra tax on UK oil and gas profits, 25% in 2022, 35% in 2023 and 38% from 2024, on top of existing taxes. |
| Water cut | Share of produced liquid that is water. |
| Feeder | A field connected to a shared trunk pipeline. |
| ARO | Asset retirement obligation: the provision in a company’s accounts for decommissioning. |
| Section 29 / back-chain | Power under the Petroleum Act 1998 to require former interest holders to contribute to decommissioning costs. |
| Cox model | A statistical method for comparing how fast things fail across groups while controlling for other factors. |
| Interrupted time series (ITS) | Comparing what happened after an event with what the earlier pattern predicted. |
| SFS | A composite index (weights: 0.5 fiscal friction, 0.3 drilling decay, 0.2 platform age stress); 0.737 in 2024. Descriptive only; no validated threshold. |
| Gate | A decision point in a decommissioning project at which the documents should be able to answer a defined question. |
Appendix C. What we have withdrawn
So that you can recognise old figures if you meet them, these earlier statements are withdrawn and should not be used:
- Hub closure probabilities for any pipeline system, and cascade timing for Forties (2029) and Norpipe (2030).
- The 2024 closure rate of 8.49% or 8.09%; the figure is 7.46% on one consistent convention.
- The water cut hazard ratio of 2.52 and the Section 29 ratios of 3.42 and 2.56, which depended on gas-only field-years that cannot record a closure.
- The lagged EPL hazard ratio of 2.02, which rested on a single year.
- Any date for a “fiscal death cross”, and the “2028 decision window”.
- The claim that EPL reform raises about £0.9bn more revenue and a revenue-neutral rate of 40 to 55%.
- Operator-type lifespan claims, including shorter lives for private-equity-backed operators.
Meginráð Research, Orkney, Scotland. jnscott@meginrao.com · meginrao.com. This guide is exploratory research and is not a regulatory approval, legal advice, financial advice or engineering assurance.
Request a no-cost pilot
Sixteen checks over two weeks on one approved public document set, with a findings table and a one-page readiness summary.
Request a Pilot